Download our vaccine donations data here: https://launchandscalefaster.org/COVID-19. Note that our vaccine donations data is up-to-date as of May 5, 2023 and we are not further updating the data or webpage content at this time.
Given that wealthy countries have purchased far more doses than they need, while supply for COVAX and bilateral deals for LMICs has struggled, dose donations have become increasingly important for vaccine equity. Ensuring enough doses to cover the most vulnerable groups in many poorer countries before the end of 2021 will require the countries that have enough to share.
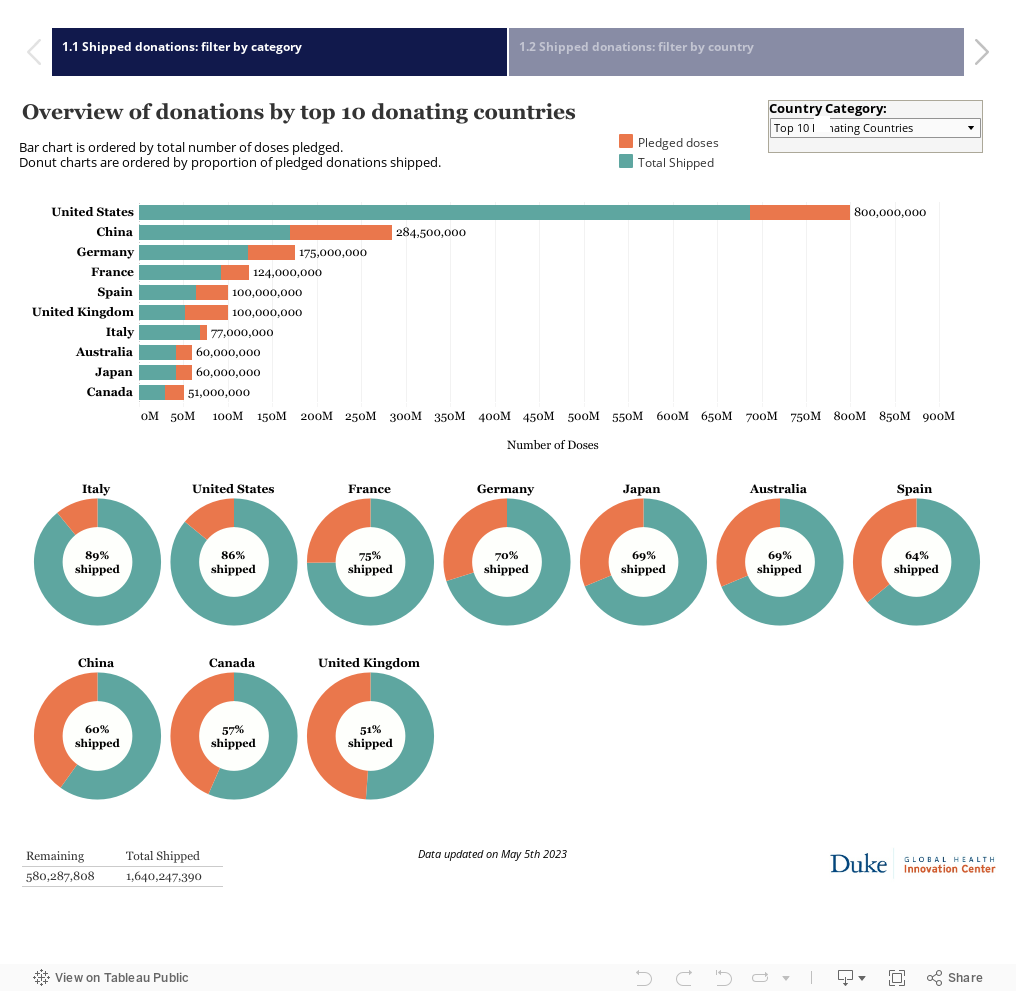
Tabs 1.1 and 1.2 show how donor countries are doing with respect to fulfilling their pledges. We have provided the data in two formats. The bar chart shows relative sizes of the pledges and amount shipped. For example, this chart shows that though the US has only shipped 17% of its pledged amount, the amount shipped is still larger than any other country has even pledged. The donut charts show progress towards the goal for each country, how close are they to fulfilling their pledges.
Some countries show 100% shipped because we only have data on donations they have shipped, rather than pledges made. For a few of the countries showing 0% shipped, we suspect they may have started shipping donations but we cannot find reliable data. As always, please help us improve this data by sharing corrections and updates with publicly available sources.
Tab 1.1 allows you to sort by category, for example, all countries in the G7. We will be adding additional categories (such as income classification) in coming weeks. Tab 1.2 allows you to select by country.
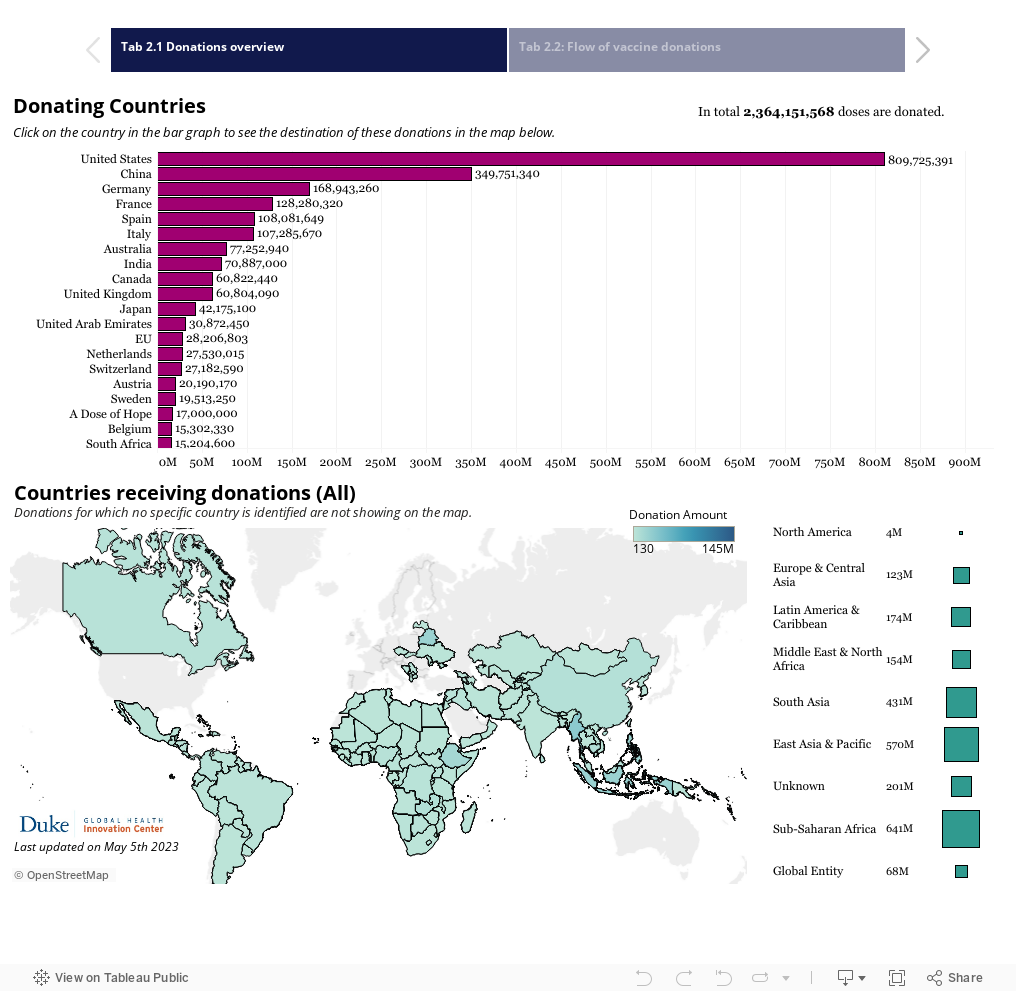
As COVID-19 vaccine supply begins to catch up with demand towards the end of 2021, we need to focus on where the existing supply is going. Tabs 2.1 and 2.2 show donations (this includes pledged and shipped and does not differentiate), by donor country, type of vaccine, and income status and region of recipient country. Clicking on a bar in the interactive bar chart in Tab 2.1 will display, in the map below, the intended recipient country(ies) when known. The squares to the right show the relative sizes of total donations by recipient region.
The Sankey chart in Tab 2.2, has dropdown menus allowing you to change the variables shown on both sides of the chart, to look at the data in different ways.